{point.name}
‘, // headerFormat: ‘{point.y:,.0f}
‘, pointFormat: ‘{point.y:,.0f}
‘, // headerFormat: ‘{point.name}
‘, }, chart: { type: ‘line’ }, title: { text: ” }, subtitle: { text: ” }, xAxis: { categories: [ ‘Jan. 2020’, ‘Feb. 2020’, ‘March 2020’, ‘April 2020’, ‘May 2020’, ‘June 2020’, ‘July 2020’, ‘Aug. 2020’, ‘Sep. 2020’, ‘Oct. 2020’, ‘Nov. 2020’, ‘Dec. 2020’, ‘Jan. 2021’, ‘Feb. 2021’, ‘March 2021’, ‘April 2021’, ‘May 2021’, ‘June 2021’, ‘July 2021’, ‘Aug. 2021’, ‘Sep. 2021’, ‘Oct. 2021’, ‘Nov. 2021’, ‘Dec. 2021’, ‘Jan. 2022’, ‘Feb. 2022’, ‘March 2022’, ‘April 2022’, ‘May 2022’, ‘June 2022’, ‘July 2022’, ‘Aug. 2022’, ‘Sep. 2022’, ‘Oct. 2022’, ‘Nov. 2022’, ‘Dec. 2022’, ‘Jan 2023’, ‘Feb 2023’, ‘March 2023’, ‘April 2023’ ], labels: { style: { color: ‘#000’ }, step: 6, y: 50, rotation: 45 } }, yAxis: { title: { text: ” }, labels: { style: { color: ‘#000’ } } }, plotOptions: { series: { lineWidth: 10 }, line: { dataLabels: { enabled: true, format: ‘{point.name}’, align: ‘right’ }, enableMouseTracking: true } }, series: [{ color: ‘#0046E6’, showInLegend: false, data: data1 }] }); ]]>
US ad employment surged in May to its highest level since 2001

You may also like
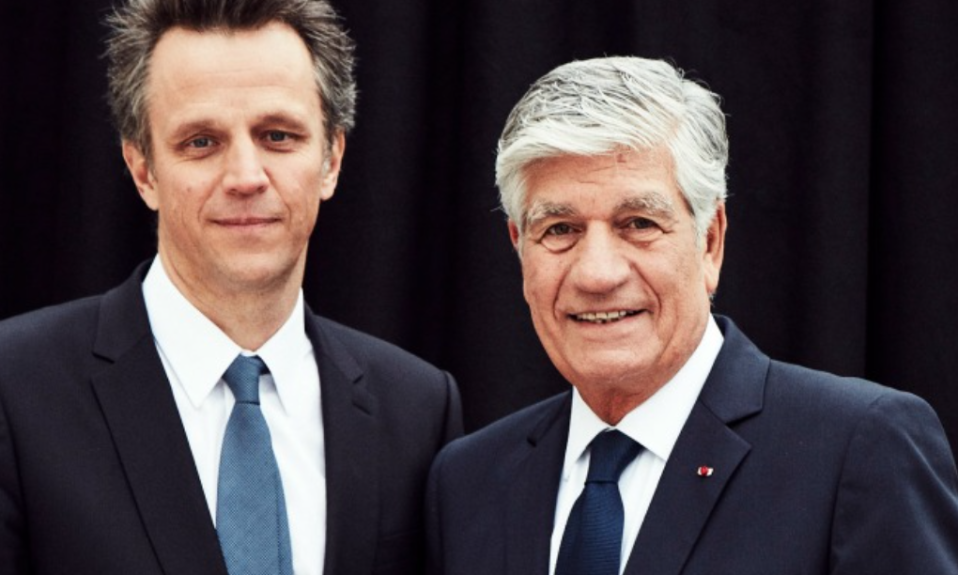
Two become one at Publicis as board changes keep role for Lévy til 2025
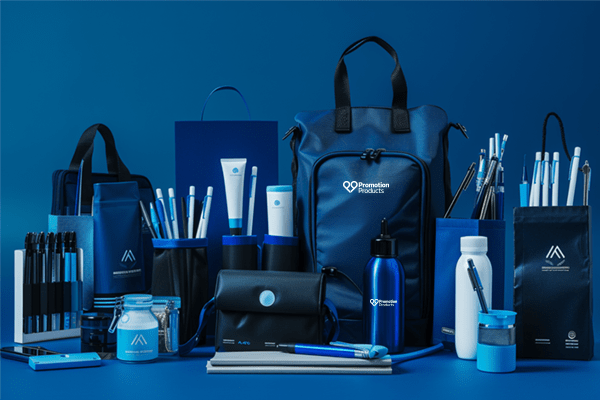
How Promotional Materials Can Transform Your Marketing
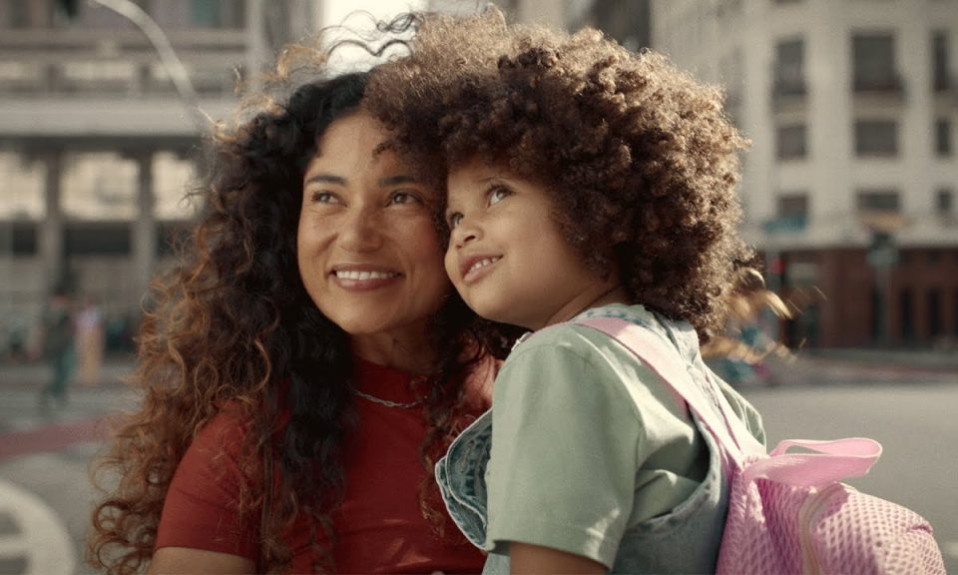
‘AI is never for us’ is Dove’s bold promise as it celebrates 20 years of ground-breaking campaign

WPP sees rise in whistleblower complaints
Currently there are no featured posts.
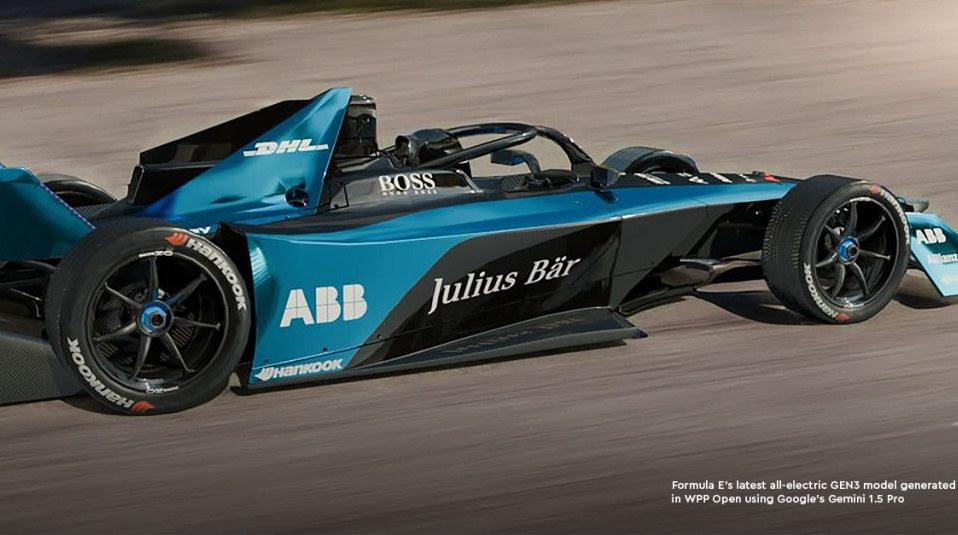
WPP goes all out for AI with Google Cloud partnership

Who will win the UK’s creative agency billings crown?
Bot Verification