How is innovation, a subjective idea that has little definition from industry to industry, being measured?
“We wanted to help kind of put some data behind— put some speed behind these innovation territories,” said Brian Hughes, executive VP, managing director of audience intelligence and strategy at Magna.
To do that, the gauge looks at three key metrics: social listening, which includes tracking keywords and mentions of certain sectors across social media; media analysis, using the frequency of certain article topics in both consumer-facing and trade news publications to see what’s making headlines; and proprietary ad spending data, which Magna’s already familiar with thanks to its robust data and forecasting capabilities.
To paint a fairly accurate picture of innovation across more than two dozen tech-based disciplines, Yao emphasizes that metrics are weighted on a case-by-case basis. “It’s not one-third of this, one-third of that,” he said.
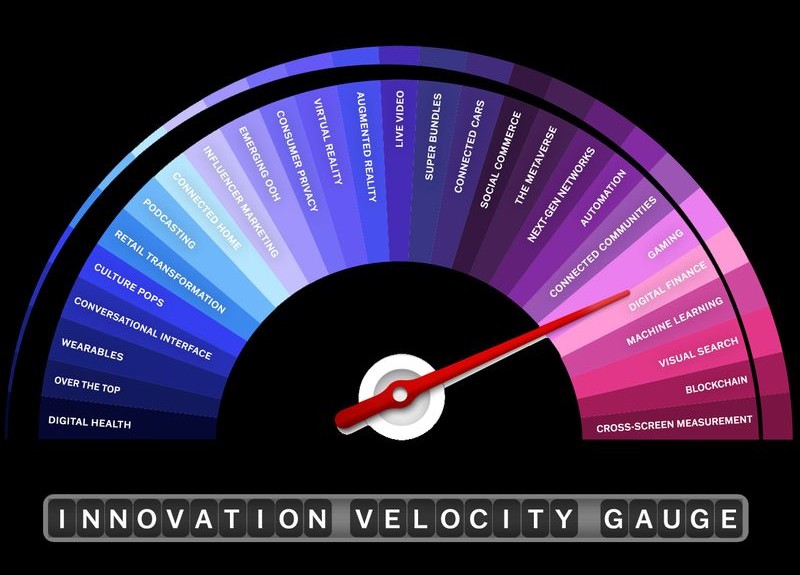
For example, Yao continues, buzzworthy “innovation territories” like gaming and the metaverse have gotten lots of consumer attention recently and are prone to score near the top of Magna and IPG Media Lab’s social listening analysis; meanwhile, the average TV viewer isn’t talking much about “cross-screen measurement,” which gets lots of press in trade publications but isn’t generating much mainstream social media discussion.
That doesn’t necessarily mean it’s innovating slower than the widely known likes of virtual reality and podcasting—in fact, cross-screen measurement is moving faster than both of those, according to the gauge. And to reflect that, it’s imperative that all data points are not compared and weighed equally across the tool’s 27 very distinct sections.
The Innovation Velocity Gauge does not have a baseline zero where different “innovation territories” can be judged as excelling or falling behind, Hughes confirmed; instead, each point on the gauge is measured on a relative scale and then placed against each of the 26 other points.
The creators of the gauge plan to update it annually, eventually using each gauge as a standard to detect changes by comparing it to the subsequent year’s gauge, he said.
“Because this is the first year we’re doing this, our hope is that next year, we have this as the baseline and we can compare year-over-year growth,” Yao added.
Subscribe to Ad Age now for the latest industry news and analysis.